Some of these projects are somewhat technical (both biologically and computationally), but we wanted to have a space for people who appreciate these types of technical details and to show the types of code we’ve written. Where possible, we’ve attempted to strike a balance between detail and readability. We’ve left off projects that mostly involved applying existing software to the analysis of different datasets (most of which are covered in Alfred’s publications), and we’ve also left off pet genomics diagnostics projects that Alfred pursued while at IDEXX laboratories (in 2022) as our understanding is that many of these efforts are still confidential, but it’s probably okay to say that these projects involved scaling AWS workflows to analyze large numbers of sequenced genetic samples.
Creating a pipeline for analyzing drug resistance data with Nanopore sequencing (July 2025)
Malaria is a microscopic parasite that kills hundreds of thousands of people every year, mostly children under the age of 5 in sub-Saharan Africa. Different strains of malaria have acquired different mutations that make them resistant to different drugs. By sequencing patient samples to determine what types of malaria each person is infected with, African researchers can make better public health decisions about which drugs to administer in which regions of a country. Nanopore sequencing is an emerging cost-effective semi-disposable DNA sequencing technology that can be as small as a flash drive, and that pulls a relatively small amount of power from a laptop. These traits make nanopore very well suited to analyzing DNA samples in rural communities with intermittent power, but in discussions with researchers in Tanzania, Uganda, Burkina Faso, and Ghana, we came to realize that both the training and pre-existing bioinformatics tools for analyzing nanopore datasets could use further development. Over the course of several weeks, we have collaboratively built and tested a snakemake pipeline for analyzing both amplicon and whole genome datasets. This pipeline uses minimap2 to align nanopore reads against a genome, then uses clair3 to call variants, snpEff to annotate variants, and a custom Python script to parse annotated variants into an amino acid table. Finally, we use a second pipeline that we originally created for MIPTools (discussed below), which converts these amino acid tables into interactive high quality plotly maps that show the prevalences of different key drug resistance mutations in different geographic regions. Together, these two pipelines can take a researcher all the way from raw reads to final high quality interactive maps of drug resistance mutation prevalences. Our hope is that this pipeline will make it easy for African researchers to analyze nanopore sequencing for drug resistance studies.
Re-packaging a ten year old set of Python2 packages as a sif file (June 2025):
DBLa domains are a highly variable region of the malaria genome, thought to be involved with immune system evasion, that may be useful as a type of molecular fingerprint (with any parasites that have the exact same fingerprints as each other being highly related to each other). The IDEEL team at UNC Chapel Hill wanted to use a suite of DBLa domain mapping software originally created by Karen Day’s group at the University of Melbourne. The software is relatively well-documented here (and is overall a very nice piece of software with well thought-out example input files) but was difficult for end-users to install due to a few challenges, including:
- the Python scripts use Python2 whereas most modern systems use Python3
- absolute paths to binary files were hard-coded into scripts that assumed a username matching the original package creator
- There were several unlisted dependencies in the software, including fastqc, mungo.fasta, HMMER, flexbar, pear, usearch, and ncbi-blast+
- Some of the dependencies were mutually incompatible (e.g. python2 with newer versions of several of the other dependencies)
- Many of the dependencies are a bit obscure
We were able to fix most of these issues by obtaining hmmer, ncbi-blast+, and fastqc from the apt repositories, and using mamba (a version of conda) to create an environment with older python2, numpy, flexbar, and r-tidyverse packages. We git cloned the original github repositories from the Day lab, as well as a copy of the Mungo DB github repository. We packaged all of this into a sif file so that end users wouldn’t need to worry about any of these dependencies, and modified the hard-coded paths in the original Python scripts to point to our newly downloaded packages. Running a custom mamba environment with older Python packages for parts of the pipeline but not others within our singularity environment was slightly tricky to figure out but was ultimately fixable with a PATH export statement. We also automated the pipeline to run in parallel using snakemake (instead of as a series of manually executed commands for each step and sequencing run) and included a copy of snakemake with our sif file. Finally, because the original pipeline expects samples that are not demultiplexed and that use a specific sample barcoding library, whereas modern Illumina sequencers usually output demultiplexed data as a part of basecalling, we created a custom python script that prepends arbitrarily assigned barcodes from the expected library to samples and re-concatenates sample reads together in such a way that the original pipeline is able to perform the demultiplexing/read cleaning step. The end result is a sif file that can be used to classify malaria samples from modern illumina datasets and can be run on any machine that has a working copy of singularity, and that accepts user-configurable input file-paths and user-defined parameters in a single centralized yaml file. Our final github repo for the sif-packaged version of this software can be found here.
MIPTools (2023-2025):
Over the past two years, a lot of our time has been devoted to improving a software package known as MIPTools, used frequently by members of the Bailey Lab at Brown (where Alfred works part time as a research professor). Alfred did this work as an employee, while Charlie donated time to this project as part of Boxwood Bioinformatics. Briefly, MIPTools is a package for designing, running, analyzing, and visualizing amplicon sequencing datasets using molecular inversion probes, or MIPs. You can read more about the pipeline here. Over the course of the last couple of years, we’ve implemented the following improvements (with over 500 github commits):
- Fixed a bug that was causing the pipeline to crash silently.
- Converted several parts of the pipeline to snakemake which allowed us to manage memory usage more efficiently and re-run only parts of the pipeline that failed
- overhauled the documentation
- created new tutorials based on Uganda published datasets with K13 mutations
- upgraded the more outdated software packages
- added an interactive user interface
- modularized individual steps of the pipeline so they could be run independently of each other.
- improved the singularity sif file building process
- added a mutation prevalence calculator and interactive plotly data visualization system, in addition to automatic publication quality figure generation.
Building a UCSC Docker web browser (2023-2025):
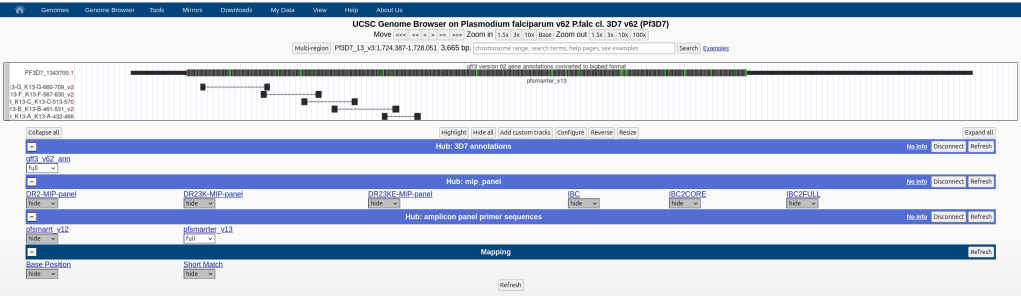
This is a Docker clone of the popular UCSC web browser, currently used primarily by the IDEEL research consortium for analyzing malaria genomic data. The page includes a public site (for disseminating published study results) and a private site (for viewing unpublished data). Using an existing UCSC docker file template, we created our own set of docker files for this and figured out how to host password protected sites. Docker offered several advantages over our previous solution of hosting a genome browser in a box virtual machine, including a lower profile than a full-blown virtual machine and the ability to simultaneously host multiple docker instances and genome browsers on multiple ports of a single host machine.
We also created a snakemake pipeline for creating annotation hubs from gff files. We populated the site with an annotated 3D7 malaria strain and with MIP and amplicon panels. We also developed a snakemake pipeline for mapping amplicon panels (and MIPs) to UCSC genome browser track hubs and developed a pipeline for converting mapped bam reads to bam and bigwig track hubs. Snakemake environments were particularly useful for several of these pipelines, allowing us to auto-install tools like blat and deeptools.
Mapping transposable elements to genomes (2023):
In addition to instructions for making an organism, most genomes are littered with decayed viruses known as transposons. Several of these transposons retain the ability to hop around within the genome. As part of a longstanding and ongoing collaboration with Travis Thomson’s research group (where Alfred worked as a research professor during 2021), we have been searching several different fly genomes for known transposons. Travis has been characterizing transposons that appear to travel between nerve and muscle cells (almost as if they were ‘infecting’ their target cells) but whose transmission is required for correct neuromuscular synapse formation. Our pipeline uses blat to lookup any gene segments within a genome of interest that have overlap with known transposons. Rather than map these gene segments back to the original genome, we map them against the consensus sequences of known transposons, which allows us to see which parts of a given transposon are found in a genome. We’ve also built a visualization tool (based off of the UCSC genome browser) to view these consensus transposable element sequences.
Building an automated single cell labeling pipeline (2023):
Single cell RNA sequencing is an approach that allows researchers to simultaneously measure which genes are active within thousands of different cells. This is useful, for example, in assessing whether cancer cells express different genes from regular cells, or for measuring how different types of cells change gene expression in response to a novel medicine. In order to perform these analyses, it’s useful to have some way of labeling individual types of cells based on whether they express specific “marker” genes that identify a cell type. As part of a consulting project, we wrote an automated snakemake pipeline that converts single cell RNA sequencing into a map of labeled cell types. Our pipeline runs cell ranger to create a table of numbered cells with yes/no calls for each gene of each cell, performs quality control by removing cells that have too many or too few genes expressed to be believable as real cells, as well as cells that express too much mitochondrial RNA (as these are frequent indicators of apoptosis). Finally, our pipeline runs seurat to generate UMAPs of gene expression for each cell and uses an R script to automatically label individual seurat clusters as neurons, macrophages, and other cell types based on the presence of unique marker genes from a table and apply these labels to the final UMAPs.
Alfred Simkin past projects (unaffiliated with consulting)
MERFISH (2022)
In March 2021 I started a bioinformatics core at Umass med school in the neurobiology department, and worked closely with Dori Schafer. Dori’s group was using a technique called multiplexed error-robust fluorescence in situ hybridization (MERFISH). Unlike traditional FISH, this approach attached multiple fluorescent molecules to FISH probes targeting hundreds of different genes, with the FISH probe of each gene corresponding to a unique set of fluorophores. The probes were added to a tissue sample and the fluorophores excited with light of different frequencies. The pattern of observed fluorescence at a given spot on a confocal microscope was used to say whether a given gene was present within a given cell. The net result was that we could assay the presence or absence of hundreds of genes within thousands of cells while preserving the spatial arrangements of these cells within a plane of brain tissue. By combining these slices (confocal microscopy can focus on different “planes” or layers of cells), we were able to obtain real-time 3D maps of gene expression in individual cells.
Several parts of these tools relied heavily on traditional single cell RNA sequencing approaches – I converted the gene expression data of individual cells into a table of numbered cells and issued yes/no calls for each gene of each cell. I performed quality control by removing cells that had too many or too few genes expressed to be believable as real cells, as well as cells that expressed too much mitochondrial RNA (as these are frequent indicators of apoptosis. I then ran cellranger and seurat to generate UMAPs of gene expression for each cell, and wrote a labeling program to label individual seurat clusters as neurons, macrophages, and other types based on their expression of different marker genes. Finally, I applied these labeled cell-types as colored points on a 3-dimensional zoomable map of the original microscopy images – allowing us to see a zoomable map of the physical placement of different cell-types.
microRNA binding site turnover simulation (Postdoctoral work, 2014-2016)
The goal of this project was to see whether observed sequence
motifs (in my case 8 nucleotide motifs known as miRNA binding sites) within
genes of interest (in my case gene regions known as 3’UTRs) evolve at rates that
are unexpected relative to simulated neutrally evolving sequences. The github code for
this (roughly 100 short scripts including 17 key scripts controlled by a driver script) is based on Python2, and the basic approach involved downloading a BED file
from the UCSC genome browser along with MAF files from a Multiz 100 way alignment
of vertebrate genomes. After extracting aligned 3’UTR material of multiple species
from these multiz alignments, I used the Phylip package DNAML to reconstruct
ancestral 3’UTRs. I then counted the observed number of times that an ancestral
nucleotide mutated into a descendant nucleotide given its neighboring
nucleotides, and used these probabilities to generate new (simulated) descendant
sequences with randomly placed mutations, which gave me simulated genomes for my
genes of interest for my species of interest. I repeated this process 100 times
to generate 100 replicates, and finally I compared the actual number of times an
8 nucleotide sequence changed in reality against the numbers seen in all 100
replicates. It was gratifying to see that known functional sequences underwent
fewer turnover events than sequences with no known function, and it was
interesting to see that there were not only fewer mutations that destroyed
functional sequences but also fewer mutations that created new functional
sequences – this implies that natural selection disfavors the accidental
creation of new functional motifs. I repeated this work in both vertebrates and flies. More findings can be found in my accompanying paper. Programmatically, this project gave me a
chance to try my hand at simulating random mutations using context information (essentially using trinucleotides to capture the probabilities of dinucleotide mutation events), and a greater
understanding of several distributions and statistical tests including my own takes on Mann-Whitney U tests, hypergeometric tests, and binomial tests. I also enjoyed developing simple functions for reading from and writing to control files
